
Customer churn is the rate at which customers stop using your product or cancel their subscriptions over a given period. Put simply, it’s how many customers leave your business over time.
Customer churn prediction uses your customer data and predictive modelling to identify which customers are most likely to leave, giving you time to intervene before they go. By combining behavioural, transactional, loyalty and support signals with targeted retention strategies, you can flag at-risk customers, prioritise your interventions, and protect revenue proactively.


Most customer churn prediction efforts die in one of two places. They collapse under their own complexity, or they end up in a spreadsheet nobody opens. Either way, same result: nice-sounding models nobody uses, and customers who keep walking out the door.
None of that is inevitable. Fixing it starts with getting the basics right, beginning with what churn prediction actually is.
Churn prediction is forecasting which of your customers will stay and which will leave, before they go. Customer churn itself is simpler: the rate at which you lose customers over time. Picture a leaky bucket. You pour new customers in the top while existing ones drain out the bottom, and no amount of pouring fixes a hole.
Churn is not one thing, though. In recurring-revenue and subscription models, it shows up in three forms:
| Type | Description |
| Voluntary churn | The customer actively decides to leave. They’re unhappy, or they’ve found something better. |
| Involuntary churn | A failed payment or an expired card. They didn’t mean to go. |
| Revenue churn | The sneaky one. The customer stays, but downgrades their spend. |
Here’s where teams stumble. They treat churn as random bad luck. It isn’t. The signs of a leaving customer sit in the patterns you already collect: usage drops, support tickets, sliding engagement scores. The data is talking. Most teams just aren’t reading it.
The second myth is that you need sophisticated AI to crack it. You don’t. Simpler models often perform just as well, and your team can actually understand what they’re doing.
Your churn rate is not fixed. It’s data waiting to become actionable retention strategies.
No single signal tells the story. You read them together. A failed payment on its own might just be an expired card. Pair it with a customer who’s stopped logging in and stopped opening your emails, and you’ve got a pattern worth acting on.
Running a loyalty scheme? You’re watching for members who stop earning or redeeming points, slide down a tier, or collect rewards they never touch. A stalled points balance is a customer losing interest in real time.
None of these is proof on its own. Together, they’re a customer edging toward the door while there’s still time to catch them.
Because the cost of doing nothing is brutal. Lose a customer and you are not losing a monthly subscription. You are losing the entire future value of that relationship, every renewal and every upgrade that would have followed.
The maths makes the case on its own. Acquiring a new customer costs five to 25 times more than keeping one you already have, depending on your industry, according to Harvard Business Review.
And Bain & Company’s Fred Reichheld, the man behind Net Promoter Score, found that lifting retention by just 5% can raise profits anywhere from 25% to 95%.
Not revenue. Profit. That’s the difference between chasing new logos and quietly banking the ones you already have.
Subscription and recurring-revenue models raise the stakes again. Between purchases there’s more time for a customer to forget why they chose you, and more time for a competitor to remind them.
Always-on engagement, whether rewards, personalised content or exclusive benefits, keeps you top of mind in the gap.
But here’s where many go wrong. They wait. Reactive retention is whack-a-mole: someone has already checked out, so you scramble a generic discount at a customer halfway out the door. It’s desperate, it half-works, and it feels like exactly what it is.
Predictive retention flips that. You catch the risk signals early and step in while there’s still goodwill to work with. The whole game is timing. Reach a customer before they’ve mentally left, and the intervention lands as attention, not panic.
Five steps take you from raw data to a working system: collect the right data, choose a prediction technique, build and test the model, flag your at-risk customers, then act while it still counts.
The aim isn’t a clever model. It’s turning what the model sees into interventions that actually protect the relationship and the revenue.
Start with the behaviour that quietly says “I’m thinking about leaving.” Usage frequency, login patterns, engagement levels, that’s your early-warning system. A customer who logged in every day and then goes dark for a week isn’t taking a break. That’s a signal.
Support tells its own story. Rising ticket volumes, sliding satisfaction scores, or a customer who stops engaging with your help resources altogether are all worth watching.
Run a loyalty programme and you’re sitting on predictive gold. Point velocity, the rate at which customers earn and burn rewards, is a live read on engagement, and paired with a churn model it can flag people slipping away well before the retention rate moves.
Watch for redemption gaps, the customers racking up points they never spend, and tier fluctuation. A customer sliding from gold to silver isn’t just losing benefits. They’re losing the emotional loyalty that kept them with you.
Historical data shows you the shape of a departure. Shrinking order values, longer gaps between purchases, customers drifting off their usual products, all of it reads as fading interest.
Demographics matter too, but not how you’d expect. Age and location barely predict churn on their own. Engagement levels within a demographic group are the part that does the work.
Avoid the “collect everything” trap. Hoard hundreds of data points and you get noise, not insight. Be ruthless about the handful of signals that actually correlate with people leaving. A few well-chosen beats a random hundred every time.
Start with logistic regression. It’s fast, it’s transparent, and it hands you a clean probability for a binary question: does this customer stay or go? Better still, it shows you which factors are moving the odds, so you’re never stuck with a number you can’t explain.
It works best when you’ve got solid historical data and a clear definition of what churn means for your business.
And a sentence like “a customer whose usage is sliding is three times more likely to leave”, with whatever multiplier your own data produces, is far easier to put to your board than the workings of a black box.
Decision trees split customers by attribute, age, spend, usage, and draw visual paths toward churn. They’re readable, they cope with mixed data types, and your marketing team can follow the logic. The catch: they over-fit, latching onto quirks in last year’s data that won’t repeat.
Random forests bundle many trees together for better accuracy, trading away some of that readability in the process.
Neural networks are the ones that catch complex, non-linear patterns in large datasets. They’re also the ones that turn into full black boxes and eat computing power to run.
When to use each method:
| Method | Best for | Pros | Cons |
| Logistic regression | Clear insights, small teams | Transparent, fast | Limited pattern detection |
| Decision trees | Visual explanations | Easy to explain | Can over-fit |
| Random forest | Balanced accuracy | Robust results | Less comprehensible |
| Neural networks | Complex patterns, big data | Highest accuracy potential | Black box, resource-heavy |
More complex rarely means more accurate. A model your team can read and maintain beats a clever one gathering dust because nobody trusts it. Start simple, prove the value, and only climb the complexity ladder when the results earn the extra trouble.
Expect data preparation to swallow a big chunk of the work. Anaconda’s 2020 State of Data Science survey put it at around 45% of a data team’s time, with cleaning alone eating over a quarter of the average day.
So clean your datasets without mercy: fix the errors, handle the missing values, standardise units across systems, and bin the duplicates and dead fields that add nothing.
Dull work, and it decides everything. Feed a model a messy dataset and you get messy predictions, however clever the algorithm sitting on top.
Build features your business can actually act on. Rolling averages (recent spend against the historical baseline), trend signals (is usage climbing or sliding?), ratios like support tickets per month of tenure. Flags such as “VIP customer” or “recent complaint” earn their place too.
The test for every feature is the same: can your team do anything about it? Knowing that 25-year-olds churn more is useless if you can’t change anyone’s age.
Split the data 80/20, train on the larger share, then judge the model on data it has never seen. Don’t stop at raw accuracy. Precision and recall tell you how well you’re catching real churners without drowning in false alarms.
And measure it in business terms, not just statistical ones. How much more revenue do you save targeting the top 10% of churn risk versus outreach fired at random?
Watch for a big gap between training and test accuracy. That’s classic over-fitting. If the model is flagging loyal customers who plainly won’t leave, or only spotting brand-new sign-ups, go back and rework your features.
Give every customer a churn propensity score: the plain percentage chance they’ll leave. Flag the top 5 to 10% as high-risk. Where you draw that line trades the cost of intervening against the value of the save.
Keep the scoring legible. You want a simple health score your team can read at a glance. When an account manager sees “Customer X: 85% churn risk”, they should know their next move without needing a data science degree.
A score on its own doesn’t tell you where to spend your effort. Segmentation does. A high-value enterprise client sitting at 20% risk needs action today. A low-spend trial user at 50%? Probably not worth the chase.
Sort your base into segments that mean something:
Then rank by churn score inside each one. That stops you pouring money into customers who cost more to keep than they’d ever return.
Set triggers that fire only when the risk is real. Flag everything above some low cutoff and you generate noise, and a team buried in noise learns to ignore the alerts.
Match the cadence to the stakes as well. Daily alerts for the VIP tier, weekly summaries for moderate risk, monthly reviews for the low-value end.
Knowing who’s at risk is worthless if you act too late. The whole point of proactive retention is reaching a customer before they’ve mentally packed up and left.
So automate the trigger: the moment a churn score crosses your threshold, the right offer should go out in hours, not days.
In practice that looks like a rule. Engagement and usage drop for a silver subscriber, so the system offers a free upgrade to gold. Underneath it sits personalisation at scale. Different segments need different moves, and a machine can run them the instant the signal fires.
Conditional loyalty rewards are proving to be more effective than simple discounts. They cost you nothing until a customer earns them, and they land as recognition rather than a price cut.
At Propello Cloud, our customers typically witness considerable engagement uplifts and retention rates from timely offers and personalised rewards at the point of contract or subscription renewal.
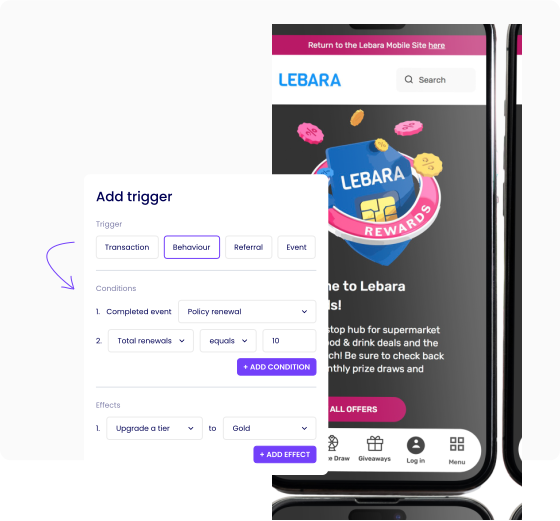
The bigger principle: run always-on engagement, not crisis management. A loyalty programme should hand out value continuously, rewards for completing actions or hitting milestones, exclusive content by tier, so the reinforcement never switches off.
That’s what builds the emotional investment that stops a customer even glancing at alternatives. So instead of a reactive “sorry to see you go” email, try proactive appreciation: “We’ve noticed you’ve been using the platform less, so here’s an exclusive reward.”
A tier upgrade, a higher-value reward, exclusive access, all of it reads as recognition, not desperation.
Track what actually matters: how many flagged customers renew once you step in, and what that revenue is worth. Build a simple payoff matrix. If a save costs £1,000 in support and rewards but returns £5,000 in retained revenue, the maths answers itself.
Then watch the engagement lifts. Redemption rates, tier-upgrade acceptance, movement in customer lifetime value, these tell you whether your interventions are building durable loyalty or just delaying the inevitable.
A working customer churn prediction model isn’t a strategy. What turns prediction into retention is the roll-out: pick one focused segment, track a handful of risk drivers, ship something practical fast, then measure the retention and revenue it actually moves and scale what works.
You don’t need perfect data or perfect tooling to start. You need to start.
Your 80/20 launch plan |
 |
| Choose your largest customer segment and concentrate on three primary risk drivers. |  |
| Begin with a region, product line, or highest-tier accounts | |
| Ship a working system in weeks, not months — perfect it late | |
| Capture early wins to get stakeholder buy-in for growth | |
Avoid project killers |
 |
| Enforce concrete launch deadlines | |
| Ship functional, not perfect — even a moderate win proves the concept | |
| Don’t sit around waiting for every single feature before launching | |
| Prioritise business outcomes, not sophisticated technology | |
Monitor success metrics |
 |
| Improvement in retention rates for customer segments | |
| Revenue saved as a result of focused interventions | |
| Customer retention cost per saved account | |
| Lifts in engagement from loyalty rewards and interventions | |
Scale systematically |
 |
| Expand to identical customer segments first | |
| Adapt successful strategies for different markets gradually | |
| Construct data pipelines to push scores into marketing systems | |
| Develop playbooks for others to replicate your success | |
Four of them bite hardest: data quality, integration, resource allocation, and compliance. And the toughest isn’t building the model. It’s wiring the predictions into the tools that act on them, your email platform, your loyalty system, your CRM, so a score actually turns into an intervention.
Everything starts with clean, integrated records across CRM, billing and support. Standardise your customer IDs, currency formats and date stamps before a single model goes near the data. A few months of clean data beats years of messy records every time.
Building the model was never the hard part. Connecting it to action is. Those churn scores have to flow automatically into your email, loyalty and CRM tools to be worth anything, and most companies badly underestimate the middleware that takes.
Budget for the skills and the running costs, not just the build. Model training and real-time scoring both burn cloud compute, and that bill lands every month, not once.
Tread carefully with data protection. Churn models feed on sensitive customer data, so you need proper security and a lawful basis to use it. Get that wrong and no retention gain is worth what it costs you.
One last thing: a churn model isn’t a build-once asset. Customer behaviour shifts, so retrain it periodically or watch its accuracy quietly decay.
Churn prediction earns the name “competitive advantage” the moment you act on the early signals instead of reading them after the fact. Do it well and acquisition stops being a treadmill. While competitors scramble to replace the customers they’ve lost, you’re keeping the ones you have and growing what they’re worth.
That’s the gap we help you close. Propello Cloud ties churn insight to automated loyalty rewards, so you can act on a prediction while it still counts. Talk to one of our loyalty experts today.
Customer churn is the rate at which customers stop using your product or cancel their subscriptions over a given period. Put simply, it’s how many customers leave your business over time.
Churn prediction uses your customer data and predictive modelling to forecast who is likely to leave before they actually do, so you can step in with retention efforts while it still counts.
It depends heavily on your model and who you sell to, so treat any single benchmark with caution. Across subscription businesses, Recurly’s network data puts a healthy annual churn rate at roughly 3 to 5%. B2B SaaS aims lower (enterprise often 1 to 2% a month, best-in-class under 1%), while consumer subscriptions tend to run higher. Watch the monthly-versus-annual distinction too: 5% churn a month works out to losing nearly half your customers in a year.
Three matter most: voluntary churn (active cancellations), involuntary churn (failed or expired payments), and revenue churn (downgrades). Each needs a different response, so it’s worth tracking them separately.
Be wary of headline accuracy figures. Because most customers don’t churn, a model can look 80 to 90% “accurate” while missing almost everyone who actually leaves. What counts is precision and recall, which measure how well the model catches real churners without flooding you with false alarms. Simpler, interpretable models are often the more reliable choice for a business team.
A churn score puts a number on each customer’s likelihood of leaving, usually as a percentage. It lets you rank your base and focus retention effort on the highest-risk, highest-value customers first.
Start with logistic regression for transparency, then reach for decision trees when you want visual, explainable paths. Both cope with numerical and categorical data and stay interpretable enough for your team to trust.
Collect usage patterns, transaction history, support interactions and engagement metrics. Focus on the signals that actually correlate with people leaving, rather than hoarding every data point you can find.
Track revenue preserved through targeted interventions, cost per saved customer, and improvements in retention rate. Business outcomes tell the real story here, not model accuracy.
Retrain roughly quarterly, or sooner if performance starts to slip. Customer behaviour keeps shifting, so a model left untouched slowly loses its edge.
Explore the platform’s scalability, features and customisation options and get answers to your unique questions.